![]()
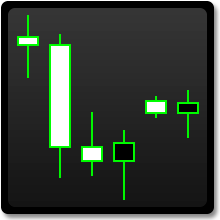
Price action is simply the raising or lowering of price, represented on a candle stick chart. It represents if there are more buyers or more sellers making trades. This action shows us exactly what is happening at any time in any market, with out having to to read the news, or turn on complicated chart tools.
 Everything you can ever know about a stock, or currency pair is represented in the price action. Price action excludes indicators like Fibonacci, Bollinger bands, Kilter channels or any other algorithm that attempts to reveal more than raw price.
What’s wrong with using those indicators? The main problem with technical indicators like MACD, RSI, correlation coefficient, Elliot wave and such is the probability of the signal being valid is low, and often open for interpretation. It’s a common analogy that a room full of 12 Elliot wave practitioners will all come to different conclusions about the wave count. This makes things non mathematical, unpredictable and low probability. It takes a lot of studying, some times years to be able to learn any of these indicators with any degree of success, and usually expensive software is needed to verify any signal.
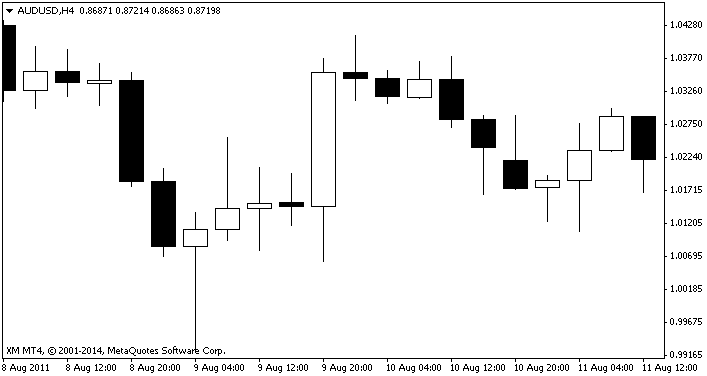
[Simple high probability price action chart]
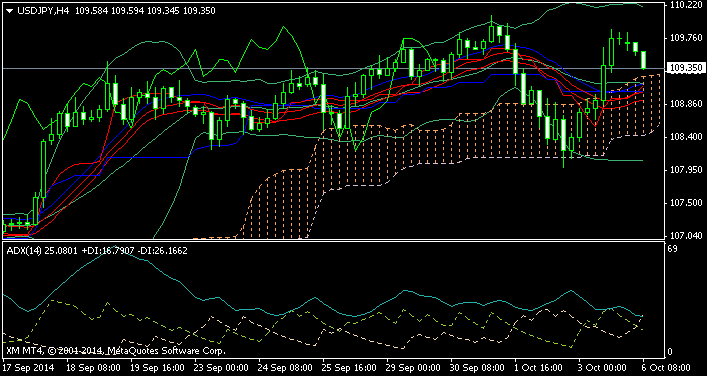
Once I show you how to simply and quickly pick the highest probability indicators, you will never have any need for anything like the chart bellow. Even looking at it is enough to give you a head ache!
[Messy, confusing and low probability technical chart]
What you need to be looking for are the highest probability trading signals. If you know the single highest probability signal, wouldn’t it be crazy to use anything else? I’ll be showing you in just a moment how to easily spot these.
Just before I continue, you have to know one thing. Trading mindset is the key to success once you can spot the indicators. I have a whole chapter dedicated to the trading mindset, but I want to cover it’s essence early to get your brain used to whats required to make profits.
Take only the sure fire winners, be prepared to let anything that isn’t absolutely perfect alone
This seems so very simple but 90% of traders find it impossible to do this, they start with good intentions and then slowly they start taking riskier and riskier trades until they are basically just playing roulette and blow their accounts. Trading can create high levels of fear, greed and excitement and it’s these emotions that will be your barrier to success if you let them. I’ll show you all the tips to avoid these costly mistakes in the later chapters, but please get it in to your head now that this is of paramount importance to be disciplined and only take perfect trade set ups. They may occur only one or twice a week, but that’s fine, and as a side benefit this reduces the amount of time you need to spend actually trading.
You don’t need to be a genius, highly motivated or any other trait you might assume you need, you only need discipline to follow the plan. I’m about to show you the simplest, highest probability chart patterns even a primary school student old can use to predict trades with. Spotting the buying and selling opportunity’s really isn’t the hard part, it’s making sure that’s all your trading! Not trading everything that moves.
If you want to be the guy sitting on a sunny beach, casually checking over charts a few hours a day and sipping ice cold Mojitos the rest of the time, then you have to train your brain now that you won’t fall in to the trap of having the odd ‘flutter’ with the charts. If you do, you will fail eventually. I will be explaining solid mind tricks and strategies in the mindset chapter a little later to help you overcome the emotion and urges that come under pressure.
It’s completely counter intuitive but the most successful way to trade is the simplest, easiest and requires the least amount of time invested. People wrongly assume they need some kind of genius to make money on the Forex markets or everyone would do it. This is simply wrong. It’s the mind set of the trader that makes him or her successful, not only the ability to read a chart. Chart reading is really not difficult, as you will find out now in the high probability indicator chapter.


