![]()
These secondary indicators add an extra dynamic to your trading arsenal by giving you some sell signals to consider. The last two signals are extremely high probability, but very rare. It’s a good idea to keep an eye for them just in case they show up on your chart.
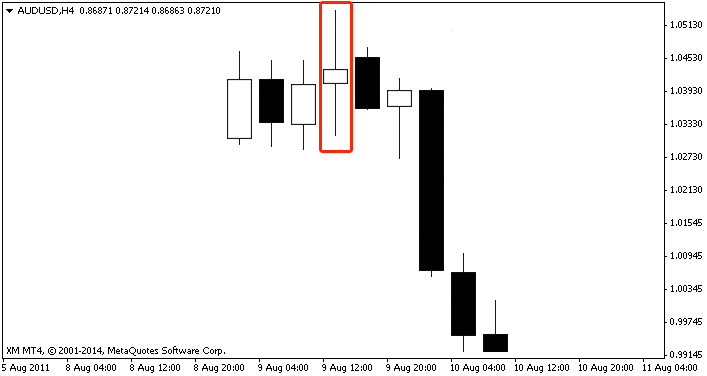
1. Spinning top
[The spinning top represents an area of indecision and is a strong reversal signal, any trend may be coming to an end soon if this shows up. A strong exit or reversal signal to be used with confluence].
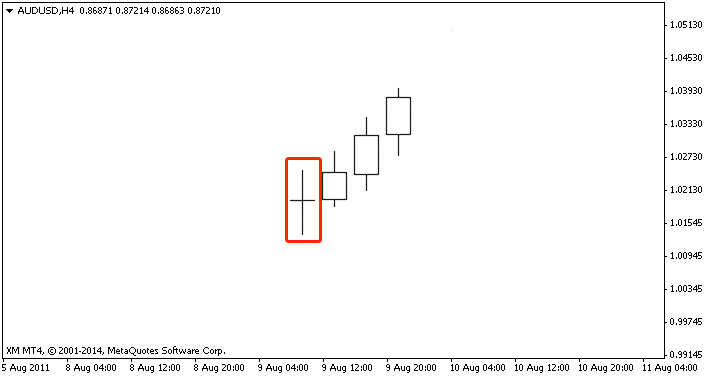
2. The Doji
[The Doji is very similar to the spinning top pattern, when found at TSR confluence levels it can signal a stall in price. If your in a trade and one of these shows up near a potential sell area, it compounds the probability you may want to exit your trade].
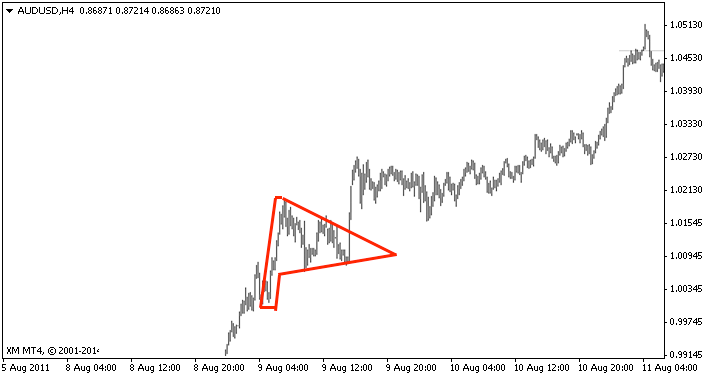
3. The pennant
[The pennant is formed after a sharp rise in price, followed by a consolidation period. If a breakout happens it usually signals a very strong and long term increase. Works the same in reverse for down trends]
4. The flag
[The flag is only different from the Pennant in shape, forms after a strong move in price up, then consolidation and a continuation of trend as long a clear breakout happens. For maximum probability enter the trade once the highest point of the flag is broken though. If a breakout fails, do not trade].


