This quick fire guide will get you up and running with MT4 in about 5 minuets, and there is a full 12 part video course at the end for in-depth features.
First you will need to download MT4 from your broker, you can find some good ones here. We advise always using MT4 or the desktop version of your brokers trading platform, web platforms are much slower and you have to be connected to the internet no matter what so there is no advantage the browser based version can give you apart from setting up MT4, which you can learn in 5 mins. Browser based platforms are also non standard, where as MT4 is the same no matter what broker you use making it easier to switch if you need to.
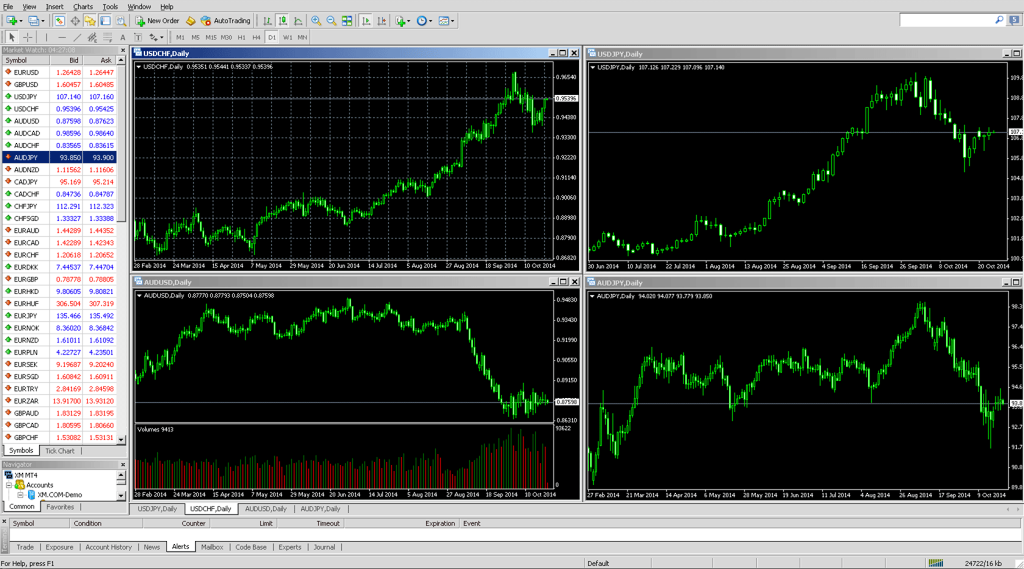
Once you login, MT4 should be available from your account tab. Download the file, run the installer. Once it’s installed you should have a screen like this.
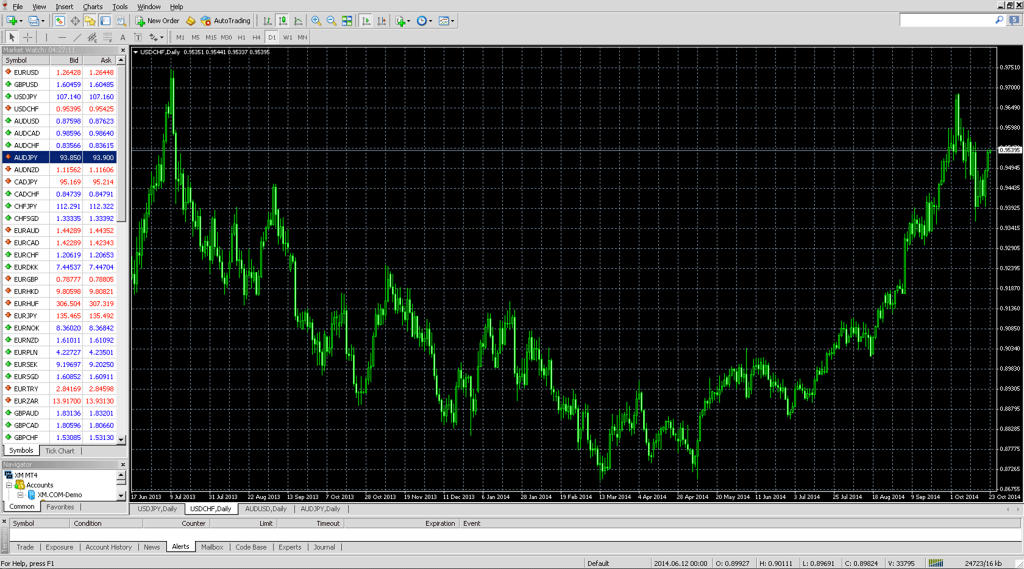
The 4 chart setting is ok, but for price action analysis is better to have a single chart. You can always revert back to the 4 charts anytime by pressing minimize. The 4 chart view is useful when you have open positions and are just monitoring. Next, just click the maximize icon on the top right of any of the charts to get a screen like this.
The grid isn’t that helpful, I prefer to turn it off for a cleaner view, just press CTRL G to toggle the grid on/off.
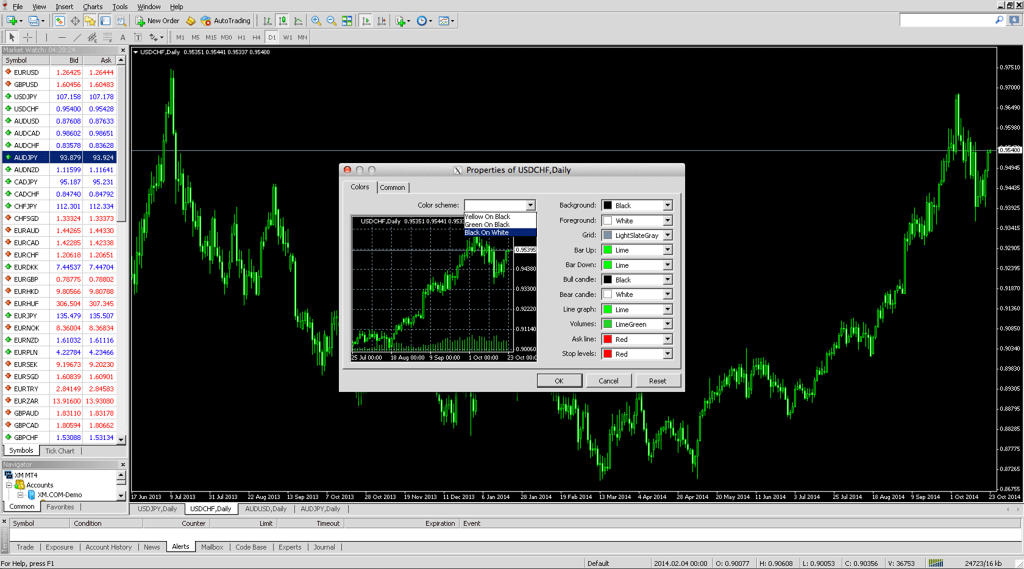
The black and green background can cause problems with vision after time, so to get a nice clean white background, right click on the chart > select properties (the last option) to open this dialog box. There is a default black and white colour scheme, or you can customize your own options. Once you have a colour scheme you are happy with, right click > template > save template > save as default.tpl. Saving as default.tpl makes your custom colour pallet the default when opening new windows.
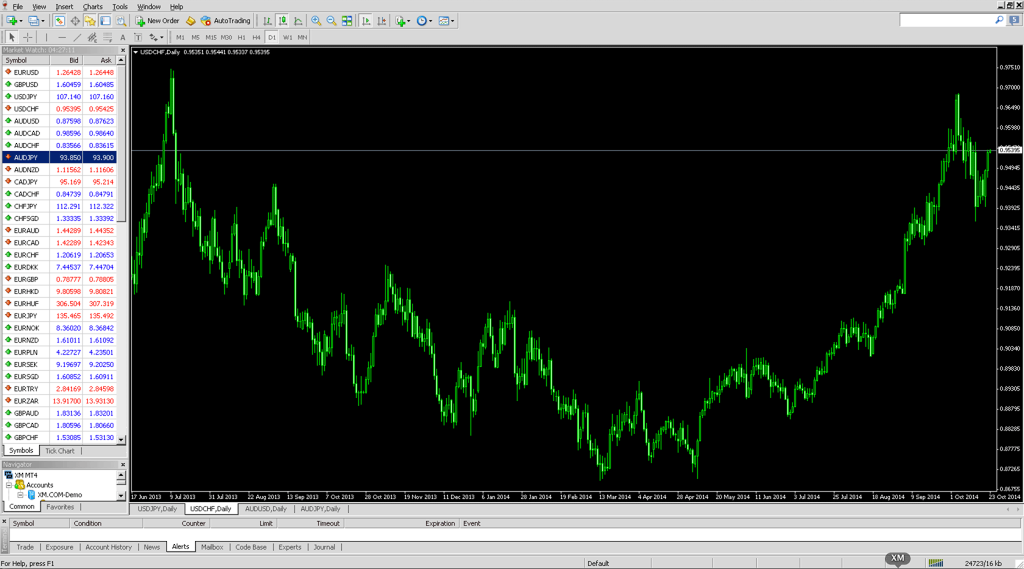
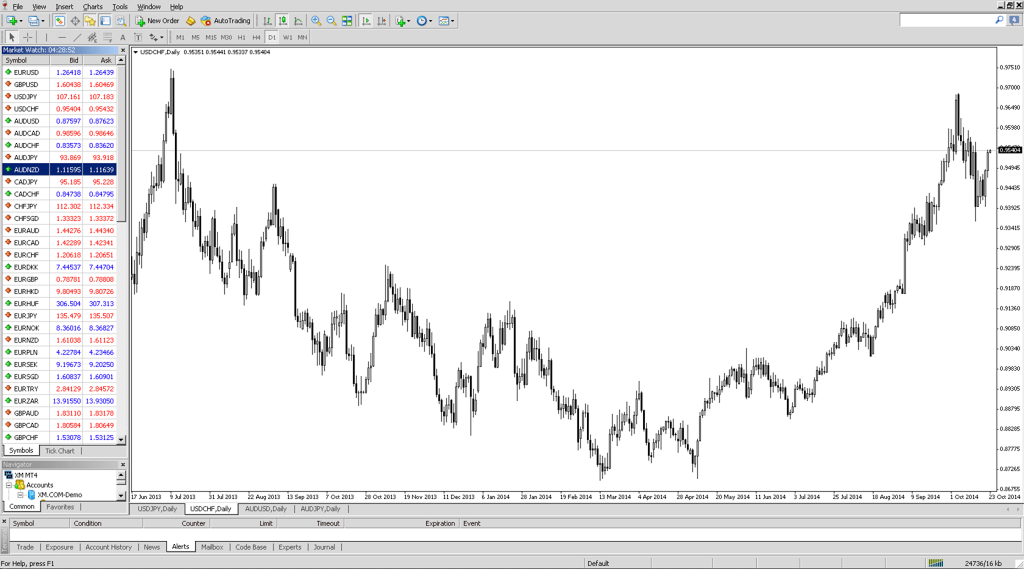
You should now have a nice clean working area like below.
Browsing charts efficiently
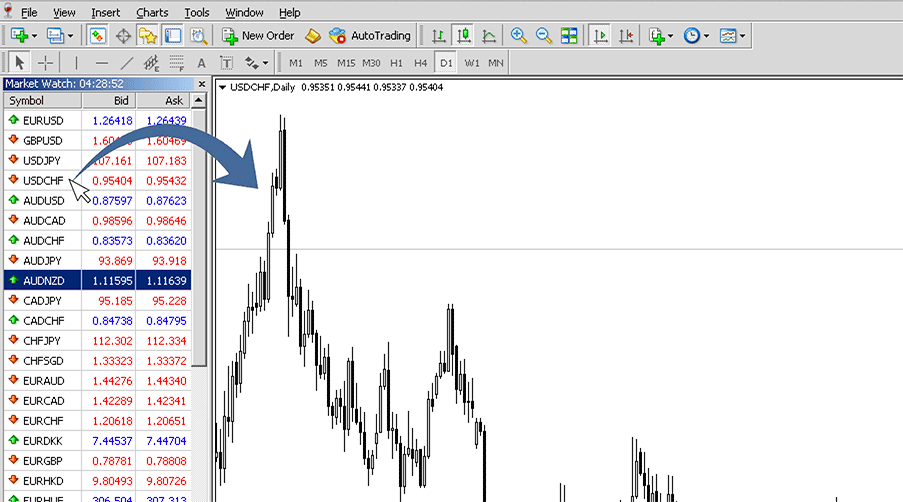
When your ready to trade, or at least look at the markets it can take some time just opening and closing charts. What most people do when the first get MT4 is to right click in the currency pair > open chart window > look at the chart > close chart > repeat. This takes about 10 seconds and gets very boring. The most efficient way to look at charts is to simply click on the currency pair and drag it into the window. This will close the last chart, and open a fresh one. Having many charts open at the same time causes high use of system use and bandwidth. This method keeps everything light, and super fast. You can just cycle through all the pairs very quickly looking for signals.
One thing that might bug you if you haven’t used MT4 before, is when you go back to look at price history the chart automatically jumps to latest price every time there is a change. Simply toggle the green arrow below to turn the price snap on/off.
You can change chart time frames here, for price action the D1 (1 day) is fine, or the H4 (4 hour).
For drawing trend or support lines, you can use the drawing tools here. Just select trend or line, and click the base point on the chart. For trends just set the base point and angle and your good to go.
Zoom in and out.
Placing and order with MT4
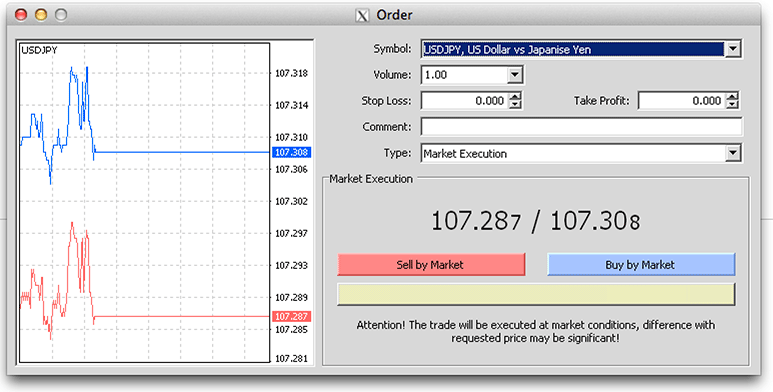
To place a new order, simply press F9. You can also choose new order from the top menu, or right click on the currency pair on the left side menu and select new order.
Volume is the amount your want to trade per point.
Stop loss sets a safety net, if the stop loss is hit your trade is automatically closed. The stop loss is the number of points away from the market order at the time you place the order.
Take profit automatically closes your position after a certain number of points are won.
Buy / Sell by market opens your position, sell if you think the price will go down (short) or buy if you think the price will go up (long). As soon as you hit either of these buttons you will be live.
You can also place a pending order if a certain price level is reached. This will not open a position immediately, it will wait until your target price is hit and then open a position in the direction your wish. You have 4 options which seems a bit confusing at first, just bookmark this page and double check the trade is in the correct direction until your used to it.
Buy limit is going long (buying) a position when a price lower than current market is reached.
Buy stop is going long (buying) a position when a price higher than current market is reached.
Sell limit is shorting (selling) a position when a price higher than current market is reached.
Sell stop is shorting (selling) a position when a price lower than current market is reached.
Sign up to our mailing list now to get the full 12 part MT4 video guide. Plus, download your free trading log to keep track of your trading success.
Top 10 Metatrader 4 (MT4) keyboard hot keys
Left Arrow — chart scrolling to the left.
Right Arrow — chart scrolling to the right.
Page Up — fast chart scrolling to the left.
Page Down — fast chart scrolling to the right.
F12 — move the chart by one bar to the left.
Shift+F12 — move the chart by one bar to the right.
Ctrl+P — print the chart.
F11 — enable/disable the full screen mode.
Ctrl+I — call the “Indicators List” window.
Ctrl+N — open/close the “Navigator” window.
Home — move the chart to the start point.
End — move the chart to the end point.
“-“ — chart zoom out.
“+” — chart zoom in.
Delete — delete all selected graphical objects.
Backspace — delete the latest objects imposed into the chart window.
Enter — open/close fast navigation window.
Esc — close the dialog window.
F1 — open this “Userguide”.
F2 — open the “History Center” window.
F3 — open the “Global Variables” window.
F4 — download MetaEditor.
F5 — switch to the next profile.
F6 — call the “Tester” window for testing the expert attached to the chart window.
F7 — call the properties window of the expert attached to their chart window in order to change settings.
F8 — call the chart setup window.
F9 — call the “New Order” window.
F10 — open the “Popup prices” window.
Shift+F5 — switch to the previous profile.
Alt+1 — display the chart as a sequence of bars (transform into bar chart).
Alt+2 — display the chart as a sequence of candlesticks (transform into candlesticks).
Alt+3 — display the chart as a broken line (transform into line chart).
Alt+A — copy all test/optimization results into the clipboard.
Alt+W — call the chart managing window.
Alt+F4 — close the client terminal.
Ctrl+Z — undo object deletion.
Ctrl+A — arrange all indicator windows heights by default.
Ctrl+B — call the “Objects List” window.
Ctrl+C — copy to the clipboard.
Ctrl+E — enable/disable expert advisor.
Ctrl+F — enable “Crosshair”.
Ctrl+G — show/hide grid.
Ctrl+H — show/hide OHLC line.
Ctrl+L — show/hide volumes.
Ctrl+S — save the chart in a file having extensions: “CSV”, “PRN”, “HTM”.
Ctrl+W — close the chart window.
Ctrl+Y— show/hide period separators.
Ctrl+D — open/close the “Data Window”.
Ctrl+M — open/close the “Market Watch” window.
Ctrl+O — open the “Setup” window.
Ctrl+R — open/close the “Tester” window.
Ctrl+T — open/close the “Terminal” window.
Ctrl+F6 — activate the next chart window.
Ctrl+F9 — open the “Terminal — Trade” window and switch the focus into it. After this, the trading activities can be managed with keyboard.


